New mapping tool gives county-by-county breakdown of air pollution
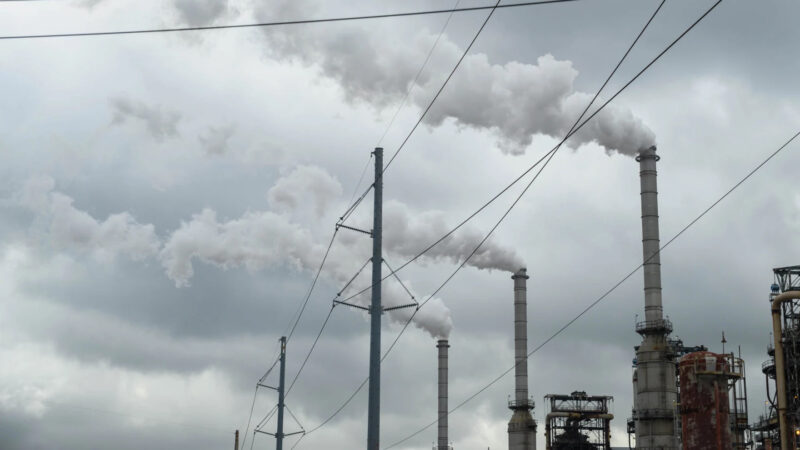
Plumes of smoke rise from three towers at Westlake Chemical's plant in Lake Charles, Louisiana.
By Halle Parker/WWNO
It’s not easy to picture what’s in the air we breathe in Louisiana and Mississippi. But earlier this month, a researcher debuted a new tool that could help. It maps pollution in the region, and some environmental groups are already using it.
Since Louisiana became the first state in the Deep South to develop a plan for tackling climate change, Louisiana Universities Marine Consortium professor Alex Kolker said he’s gotten more questions from people about the quality of the air and where pollution comes from.
“There has been longstanding concern about air pollution and its impact on communities, and I think we’ve seen a renewed interest in that in the last couple of years,” he said.
As one of the scientists advising the state’s first Climate Task Force, Kolker said he wanted to help bridge some of the existing information gaps and make the data more accessible. So, he started mapping air emissions across Louisiana and Mississippi.
He used a giant database managed by the science arm of the European Union. The Emissions Database for Global Atmospheric Research, or EDGAR, estimates the amount of emissions produced across the planet to within 6.5 square miles .
“When I saw this dataset, I realized that it could be useful for us here in Louisiana. I had never seen anything at this level of detail before,” Kolker said.
His team did those calculations at the parish, or county-level for three types of greenhouse gases and 10 air pollutants annually.
“You could almost imagine that we put a cookie cutter, the size of each parish on that global data set,” he said.
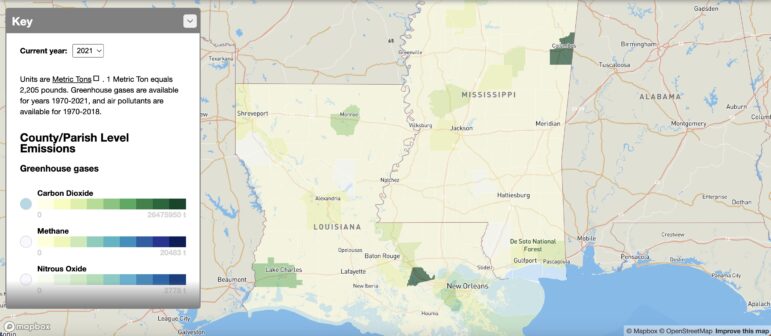
Look at the emissions of methane, one of the most potent greenhouse gases, and the interactive map clearly illustrates the hotspots for emissions across the two states: southwest Louisiana and central Mississippi. Another click and the map shows how methane emissions have changed in that area over time, dating back to 1970.
A user can also toggle between layers that give a snapshot of an area’s demographics or where major greenhouse gas emitting facilities are located.
The emissions data isn’t exact because it’s based on estimates and calculations rather than real-time air monitoring. For greenhouse gas emissions, it’s accurate within 7% to 16% of what’s calculated. It isn’t clear what the margin of error is for other air pollutants.
Despite the limitations, environmental groups have begun planning ways to use the tool.
In Baton Rouge, the Ocean Conservancy’s Nayyir Ransome works with communities on issues surrounding Louisiana’s ports.
Ransome said they’ve gone through training with the new tool and was impressed with the user-friendly design.
“You don’t want to go in certain communities with this high-level scientific jargon. You really want to meet people where they are, so that they can make well-informed decisions,” Ransome said. “It definitely gives a clear visual, and it’s also something that communities can use and play around with and like really kind of get a sense of the impacts in their own like backyards.”
Kendall Dix is the national policy director for Taproot Earth, another environmental advocacy group that works on the Gulf Coast, and he agreed with the power of the map as a teaching tool not only for community members but decision-makers who don’t understand what it’s like to live with chronic air pollution.
“Poor communities, black communities, indigenous communities often aren’t believed when they’re describing their reality. You’ve seen some of that in the way that institutions have denied that ‘Cancer Alley’ even exists,” Dix said.
The term “Cancer Alley” refers to a heavily industrialized, 85-mile stretch of the Mississippi River running from Baton Rouge to New Orleans that holds more than 100 petrochemical plants. A ProPublica analysis found that the region is one of the country’s largest hotspots for toxic air. Kolker has research that hasn’t been published yet – it’s still undergoing journal review – that found that the region also produces a disproportionate amount of Louisiana’s greenhouse gas emissions.
Advocates say data presented by scientists can help support communities in the area as they advocate for themselves in the face of political headwinds.
“Once they’re believed, that’s oftentimes when resources can start flowing in,” Dix said.

40 years after ‘Purple Rain,’ Prince’s band remembers how the movie came together
Before social media, the film Purple Rain gave audiences a peak into Prince’s musical life. Band members say the true genesis of the title song was much less combative than the version presented in the film.
Park Fire in California could continue growing exponentially, Cal Fire officer says
Cal Fire has confirmed that over a hundred structures have been damaged in the Park Fire, which grew overnight near Chico, Calif. Difficult firefighting conditions are forecast through Friday night.
Checking in with Black voters in Georgia about the election, now that Biden is out
Some voters who could be key to deciding who wins Georgia. What do they think about Vice President Harris becoming the frontrunner in the race to be the Democratic nominee?
Tahiti’s waves are a matter of ‘life and death’ for surfing Olympics
Tahiti's Teahupo'o wave has a slew of riders for the Paris 2024 Olympics. NPR finds out why it's called one of the most dangerous waves.
Researchers are revising botanical names to address troubling connotations
Since the mid-1700s, researchers have classified life with scientific names. But some of them have problematic histories and connotations. The botanical community is trying to tackle this issue.
A spectacular opening ceremony wowed a global audience despite Paris’ on-and-off rain
The Paris Olympics opening ceremony wowed Parisians, fans and most everyone who was able to catch a glimpse of thousands of athletes floating down the Seine to officially begin the Games.